Quickstart
The Plums plot allows to visualize objects detection and segmentation results.
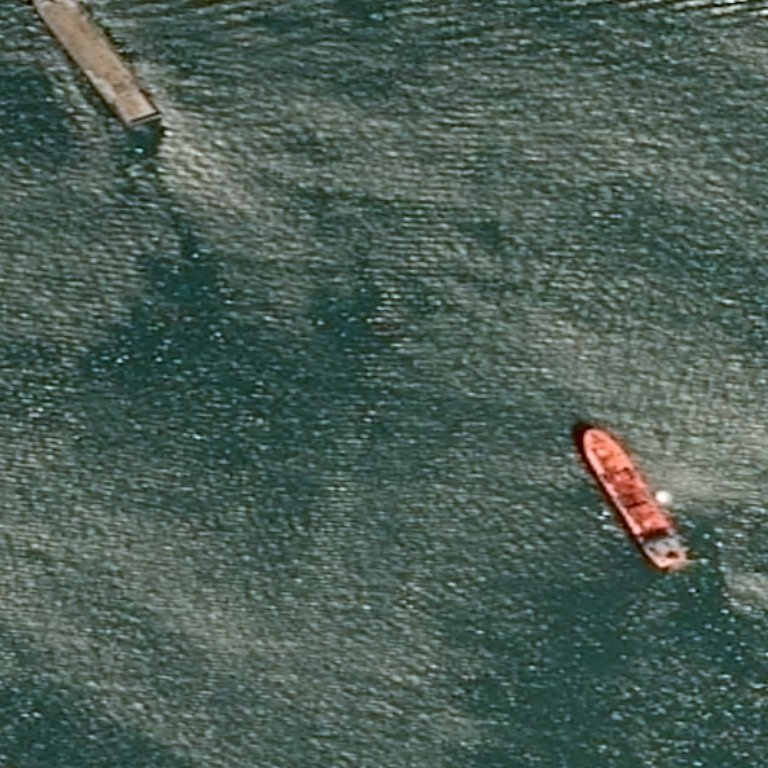
In this QuickStart, we will use the following image:
Plums plot uses two components to create figures, the StandardPlot or the PairPlot interfaces
(which all behave in a similar fashion: one accumulates DataPoint-like elements with
add() and aggregates them into a single figure with
plot()), and the Descriptor API.
Each Plot class has slight differences:
StandardPlottakes aTileand a singleRecordCollectionfor eachadd()call.PairPlottakes aTileand a pair ofRecordCollection(implicitly interpreted as predictions and ground-truths respectively) for eachadd()call.
import numpy as np
import PIL.Image
import plums.commons.data as data
from plums.plot.plot import StandardPlot, PairPlot
from plums.plot.descriptor import Labels, Confidence

# Make the prediction record collection
records = [
    data.Record(
        [[[100, 100], [100, 150], [150, 150], [150, 100], [100, 100]]],
        ['Ship'], confidence=0.9),
    data.Record(
        [[[500, 500], [550, 550], [500, 600], [450, 550], [500, 500]]],
        ['Bus'], confidence=0.62),
    data.Record(
        [[[250, 0], [300, 0], [275, 25], [300, 50], [250, 50], [275, 25], [250, 0]]],
        ['Car'], confidence=0.5),
    data.Record(
        [[[300, 300], [320, 280], [420, 380], [400, 400], [300, 300]]],
        ['Ship'], confidence=0.3),
    data.Record(
        [[[650, 300], [670, 280], [770, 380], [750, 400], [650, 300]]],
        ['Ship'], confidence=0.86),
    data.Record(
        [[[-20, 600], [50, 600], [50, 650], [-20, 650], [-20, 600]]],
        ['Car'], confidence=0.927),
    data.Record(
        [[[650, 450], [650, 550], [600, 550], [600, 450], [650, 450]]],
        ['Ship'], confidence=0.927),
    data.Record(
        [[[500, -50], [550, -50], [550, 50], [500, 50], [500, -50]]],
        ['Bus'], confidence=0.885),
]

# Make the ground truths record collection
records_ground_truths = [
    data.Record(
        [[[30, 0.], [125, 130], [165, 120], [80, 0], [30, 0]]],
        ['Ship']),
    data.Record(
        [[[580, 440], [610, 430], [690, 560], [660, 570], [580, 440]]],
        ['Ship']),
]

# Create collection
record_collection = data.RecordCollection(*records)
record_collection_ground_truths = data.RecordCollection(*records_ground_truths)

 # Open a tile
tile = PIL.Image.open('image.png')

# Plot the results with StandardPlot
plot = StandardPlot(Labels(),
                    secondary_descriptor=Confidence(),
                    title='StandardPlot',
                    fill=True,
                    plot_tag=Confidence())
plot.add(tile, record_collection)
plot.plot('StandardPlot.png')

# Plot the results with PairPlot
plot_pair = PairPlot(secondary_descriptor=Labels(),
                     title='PairPlot',
                     plot_tag=Labels(),
                     fill=True)
plot_pair.add(tile, record_collection_ground_truths, record_collection)
plot_pair.plot('PairPlot.png')
Code breakdown
Make record collections and the tile
The first step would be to construct a few Record with different coordinates in the image and one label for each and
to store them in a RecordCollection as predictions or ground truths.
import plums.commons.data as data

records = [
    data.Record(
        [[[100, 100], [100, 150], [150, 150], [150, 100], [100, 100]]],
        ['Ship'], confidence=0.9),
    data.Record(
        [[[500, 500], [550, 550], [500, 600], [450, 550], [500, 500]]],
        ['Bus'], confidence=0.62),
    data.Record(
        [[[250, 0], [300, 0], [275, 25], [300, 50], [250, 50], [275, 25], [250, 0]]],
        ['Car'], confidence=0.5),
    data.Record(
        [[[300, 300], [320, 280], [420, 380], [400, 400], [300, 300]]],
        ['Ship'], confidence=0.3),
    data.Record(
        [[[650, 300], [670, 280], [770, 380], [750, 400], [650, 300]]],
        ['Ship'], confidence=0.86),
    data.Record(
        [[[-20, 600], [50, 600], [50, 650], [-20, 650], [-20, 600]]],
        ['Car'], confidence=0.927),
    data.Record(
        [[[650, 450], [650, 550], [600, 550], [600, 450], [650, 450]]],
        ['Ship'], confidence=0.927),
    data.Record(
        [[[500, -50], [550, -50], [550, 50], [500, 50], [500, -50]]],
        ['Bus'], confidence=0.885),
]

records_ground_truths = [
    data.Record(
        [[[30, 0], [80, 0], [165, 120], [125, 130], [30, 0]]],
        ['Ship']),
    data.Record(
        [[[580, 440], [610, 430], [690, 560], [660, 570], [580, 440]]],
        ['Ship']),
]

records_collection = data.RecordCollection(*records)
records_collection_ground_truths = data.RecordCollection(*records_ground_truths)
Then, we need to open and instantiate the Tile with the image:
import numpy as np
import PIL.Image
import plums.commons.data as data

tile = PIL.Image.open('image.png')
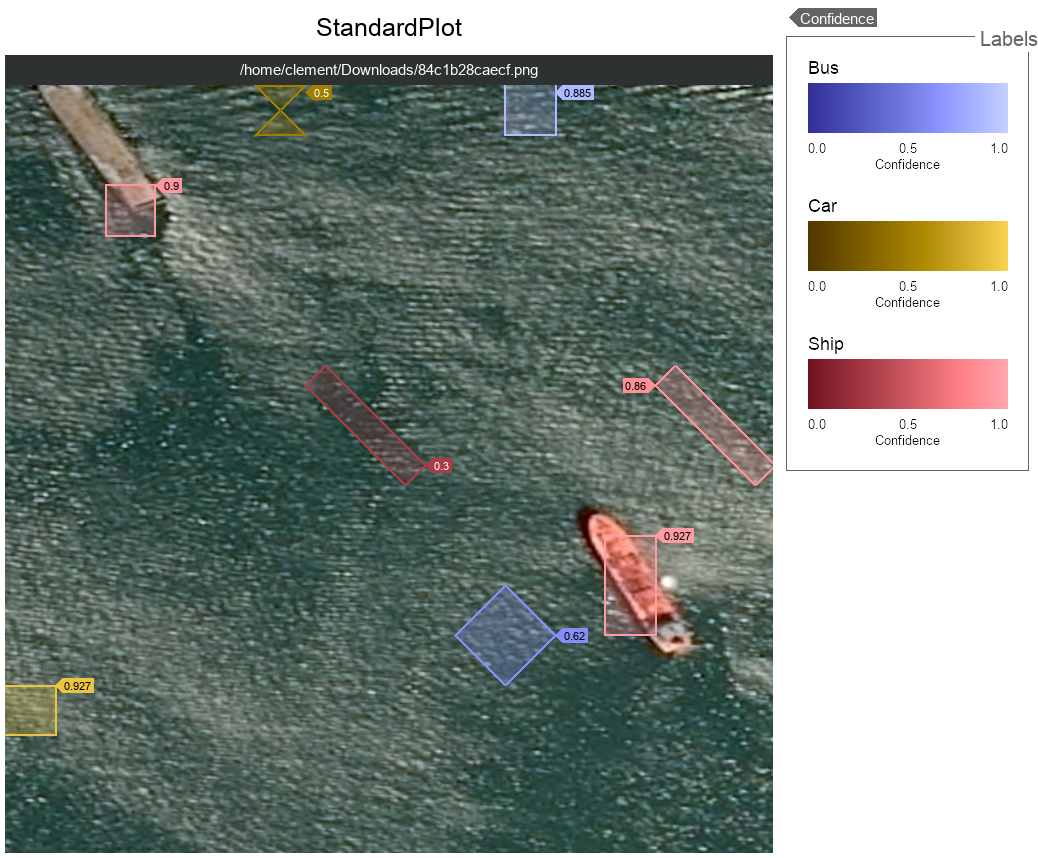
StandardPlot
The StandardPlot will compose a figure by painting each record contained in the RecordCollection on the Tile.
It can use one or two descriptors to classify the objects contained in a RecordCollection.
In this example, we use Labels as first descriptor which is used to extract the
labels from
each Record and the Confidence as secondary descriptor which is used to extract their
confidence property.
from plums.plot.plot import StandardPlot

plot = StandardPlot(Labels(),
                    secondary_descriptor=Confidence(),
                    title='StandardPlot',
                    fill=True,
                    plot_tag=Confidence())
 plot.add(tile, record_collection)
 plot.plot('StandardPlot.png')
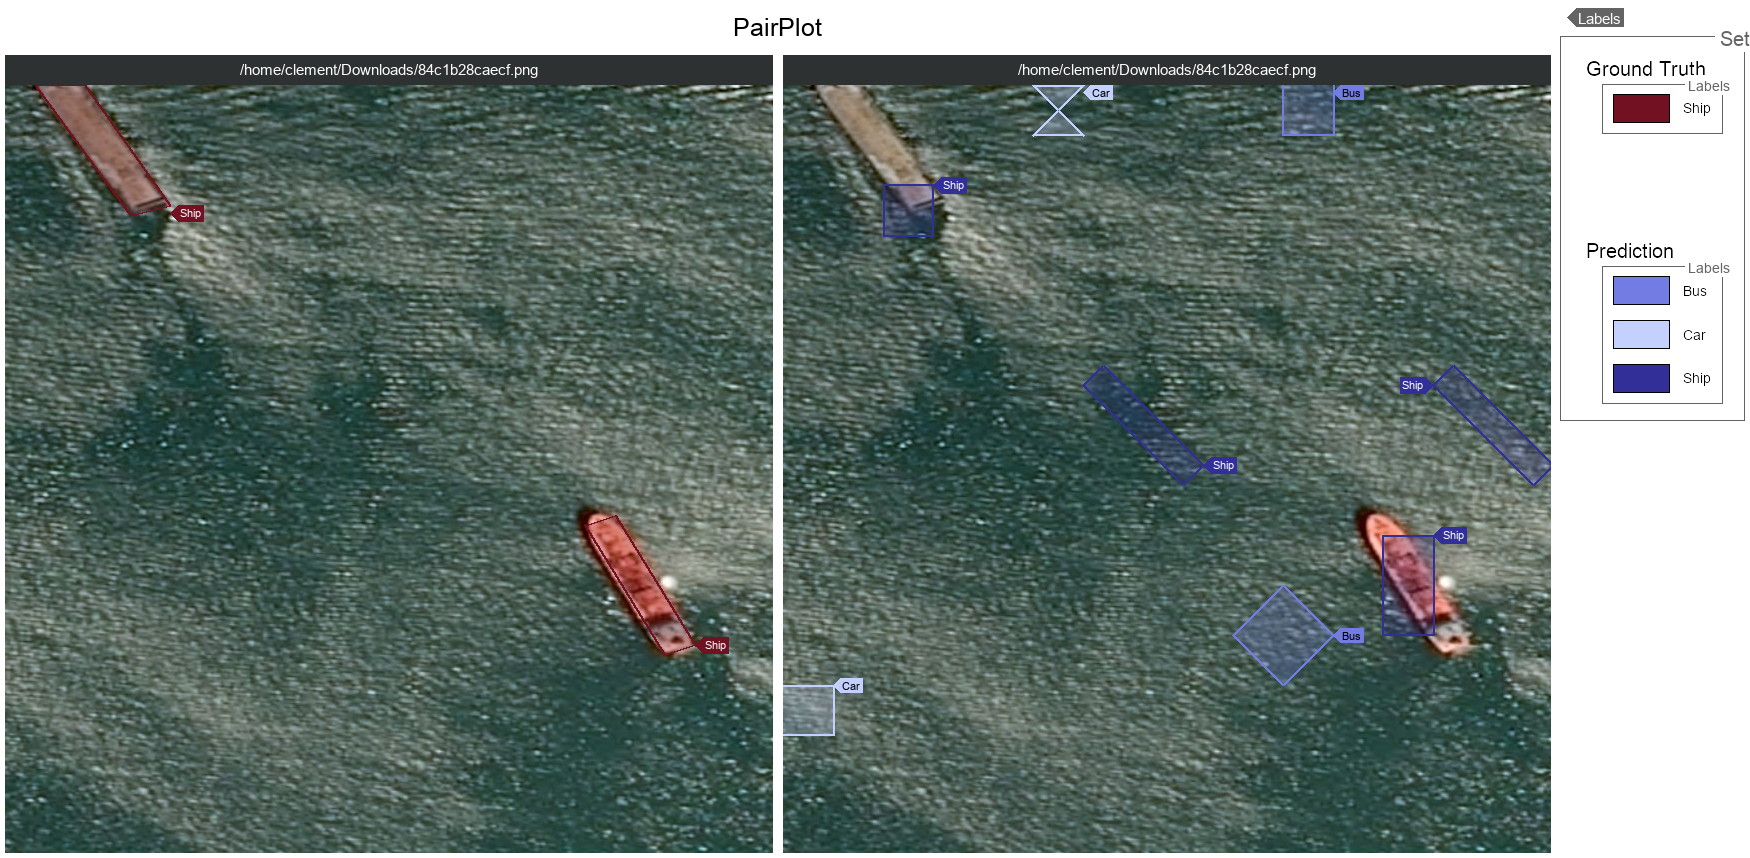
PairPlot
An other way to paint your records is to use the PairPlot which provides two layouts.
The PairPlot will compose a figure by painting the ground truths and the predictions.
It accumulates the ground truths RecordCollection and one or several predictions RecordCollection.
- You have two options :
Painting the ground truths and the predictions on the same tile.
Painting the ground truths and the predictions on different tiles.
In this example, we use Labels as secondary descriptor and we paint the ground truths and the predictions on
different tiles.
from plums.plot.plot import  PairPlot

plot_pair = PairPlot(secondary_descriptor=Labels(),
                     title='PairPlot',
                     plot_tag=Labels(),
                     fill=True)
plot_pair.add(tile, record_collection_ground_truths, record_collection)
plot_pair.plot('PairPlot.png')